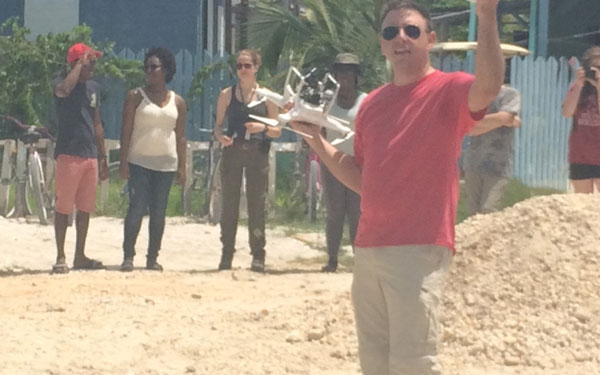
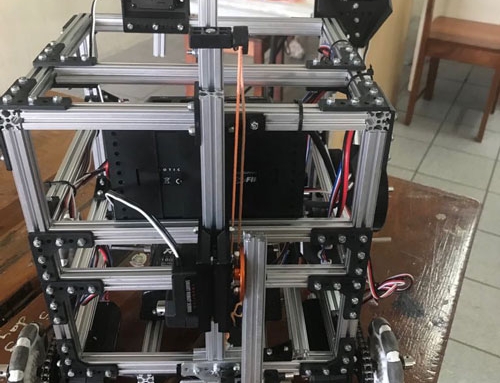
How can Belizean youth educate themselves and others about the problem of marine debris on Caye Caulker and possible solutions, using technology? In the second year of our collaborative community GIS project with Dr. Timothy Hawthorne and Dr. Christy Visaggi of Georgia State University, Ocean Academy students learned the basics of mobile mapping, the power of maps and GIS, and the power of collaborative, community-based fieldwork. We used the ArcGIS Collector application to do collaborative fieldwork in four separate teams (Georgia State students and Ocean Academy Form 2 students) to examine marine debris hotspots on the island. Prior to the fieldwork, Ocean Academy students used local knowledge to set up a fieldwork plan and target hotspot areas where we could use the collector app to collect marine debris data.
Highlights of the ArcGIS Collector application: Every 15 paces on the eastward facing side of the island we collected a point in the app (westward side was too rugged with mangroves to access: we will continue this in the near future with mapping from kayaks and drones). At each point, using drop downs and notes fields in the app, we collected the following information:
- Type of debris (plastic bottle, bottle cap, clothing, etc)
- Estimated amount of debris broken into numeric ranges (some places had over 500-1000 pieces of debris!)
- Condition (whether weathered or newer)
- Null points where there were no debris for an eventual interpolated surface
- Cleanup (how easy or not it would be to cleanup the site: easy, moderate, very difficult)
- Evidence of a trash can or recycling bin in sight
The goal was to visualize the extent of the problem to confirm/contradict local, anecdotal evidence and also begin a data collection methodology that the youth at Ocean Academy could continue to collect and monitor every few months for a long-term monitoring strategy. The data also will be used to develop an action plan for clean-ups and new trash cans, etc.
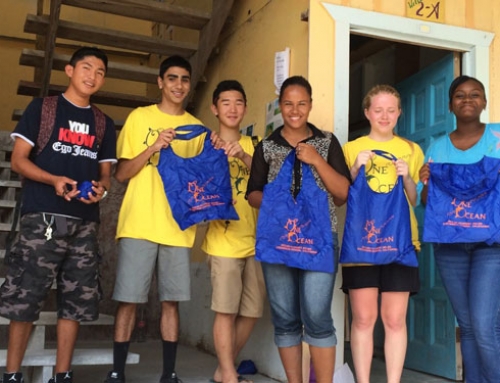
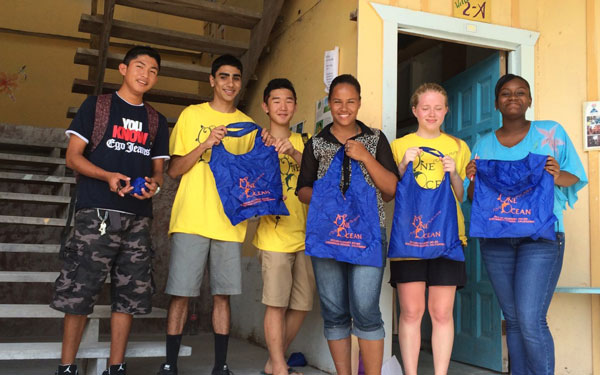
When we used the app we used peer to peer learning. Georgia State students taught one Ocean Academy student how to use Collector (in about 2 minutes or less), then that student had to teach his/her friend, and so on.
For the GIS analysis we are finalizing the following: locations of debris hotspots in relation to residential vs. commercial/tourism zones. The initial patterns seem to suggest the problem is more widespread the further one gets from the main tourism area. We are also creating buffers around the existing trash cans and doing additional analysis near the largest hotspot areas to show where additional trash cans can be placed in the near future. We are also creating heat maps to visualize where the hotspots areas are for each type of debris (plastic bottles are the worst of the debris on the island). Finally, soon we will have a web map through ArcGIS Online of all the data to showcase the results.
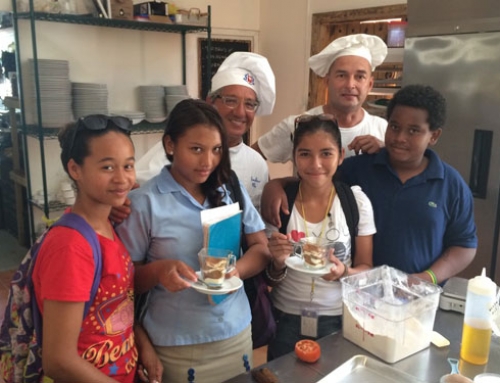
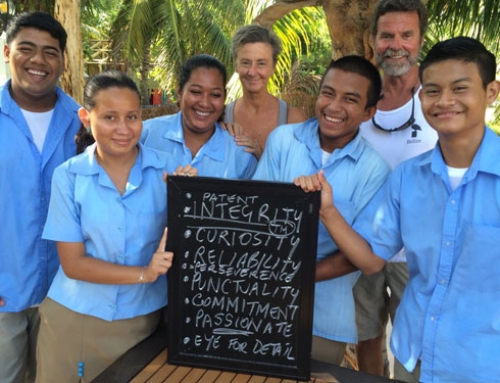
In addition to the GIS maps and results is the largest intangible: the learning and passion shared between the Ocean Academy youth and Georgia State college students across international boundaries. Everyone learned from each other. The local knowledge of the youth drove the project, and college students responded by teaching GIS and mapping skills to the youth. It was a very rewarding collaboration and we are excited to continue the work together.